
How DoorDash Saves Tens of Millions of Dollars Per Year by Detecting Fraud 30× Faster
A daily anomaly detection system that cut discovery time from 100+ days to under three.

Fellow Data Tinkerers!
Today we will look at how DoorDash uses anomaly detection to save millions of dollars by flagging fraud trends early.
But before that, I wanted to share with you what you could unlock if you share Data Tinkerer with just 1 more person.
There are 100+ resources to learn all things data (science, engineering, analysis). It includes videos, courses, projects and can be filtered by tech stack (Python, SQL, Spark and etc), skill level (Beginner, Intermediate and so on) provider name or free/paid. So if you know other people who like staying up to date on all things data, please share Data Tinkerer with them!
Now, with that out of the way, let’s get to DoorDash’s fraud detection!

TL;DR
Situation
Fraud trends at DoorDash often blended into normal delivery noise and went unnoticed for weeks, causing avoidable losses. Existing detection was reactive and too slow.
Task
Detect emerging fraud trends early across millions of users and segments, before they materially impact top-line metrics.
Action
Build a daily anomaly detection platform that segments key fraud metrics across millions of overlapping dimensions, applies time-series z-score detection, clusters related anomalies and routes them into an ops investigation workflow.
Result
Cut average fraud detection time from 100+ days to under 3 days, surfaced 60%+ of new fraud trends early, and saved tens of millions annually.
Use Cases
Anomaly detection, fraud detection, payment monitoring, policy change impact monitoring
Tech Stack/Framework
Apache Airflow, DuckDB, Apache Spark, Python
Explained further
Fraud trend detection before it becomes a headline
Fraud doesn’t always kick the door down. Sometimes it slips in through the side window and blends into the noise of millions of legitimate deliveries.
A small spike in refund claims. A pattern in high-risk charges linked to a specific bank. A subtle shift in behavior that looks like randomness until it isn’t. Left alone, those early signals can snowball into a large trend with real top-line impact.
DoorDash’s fraud team wanted to flip the script. Instead of reacting after a new fraud trend has had weeks to grow unchecked, how could they spot it as early as possible, before significant damage is done?
This post shares how the DoorDash team built an anomaly detection platform that scans for emerging patterns across millions of user segments and surfaces the ones that matter before they spiral into major losses.
Terminology
‘Anomaly detection’ is a broad term. Even within fraud, people can mean very different things by it. For this system, DoorDash defined two categories up front:
Anomalous trend detection
Looking for anomalous behavior in a collection of users that may represent a new fraud or false-positive trend.
Here, no single datapoint needs to be weird. The anomaly is the time-series pattern that emerges from many points together, like a growing fraud segment over time.
Anomalous outlier detection
Looking for individual outliers, like a specific user or transaction that is rare or deviates sharply from normal behavior.
In this case, the datapoint is the anomaly. It might be part of a broader trend, or it might be a one-off.
This post focuses how DoorDash built a system to detect anomalous trends.
Here are some terms used within the article and their definitions and examples to make them easier to understand.
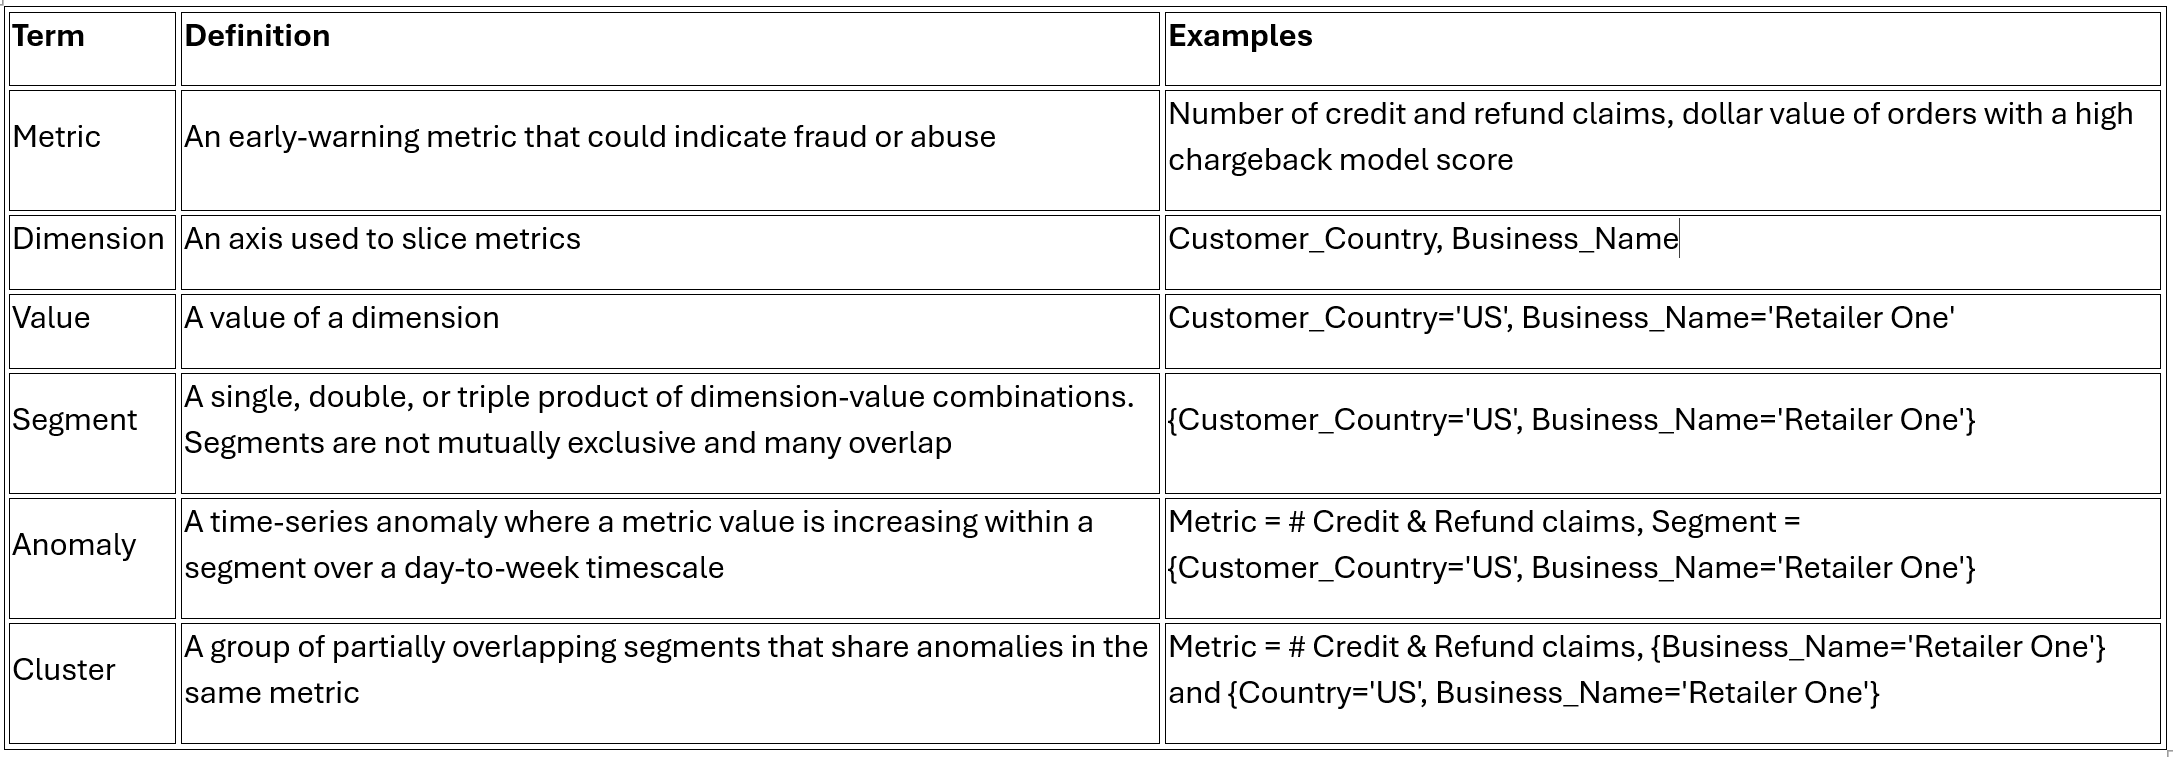
Designing the system around real fraud failures
The DoorDash team started the way you’d hope a fraud platform starts: by talking to the people who have to use it.
They met with frontline fraud teams responsible for tracking and fighting new fraud trends and asked for concrete historical examples of trends that simmered longer than ideal before being discovered and mitigated. These became the positive test cases.
Next, the teams were asked for:
Their most useful early-warning indicator metrics
The dimensions they commonly use to slice data when investigating a new fraud trend
That produced a working set of:
Positive examples (historical missed or late-found fraud trends)
A set of metrics that act as early-warning signals
A set of dimensions that represent how investigators naturally segment the world
Then the DoorDash team built the system and backtested it. Tuning came next, but the tuning goal was very specific:
1- Maintain 100% recall on the test trends
2- Minimise the number of non-fraudulent anomalies per day
One observation stood out from this phase. The system was fairly insensitive to exact tuning values. What mattered more was upstream: choosing thoughtful metrics and dimensions that can actually capture fraud trends in the first place.
In other words: the math is important but the slices you choose decide what you can even see.
Architecture overview
The anomaly detection platform runs as a daily job coordinated by Airflow. It looks for fraud trends growing on a day-to-week timescale.
DoorDash currently runs anomaly detection jobs for both consumer fraud and Dasher fraud, with plans to expand to more applications over time.
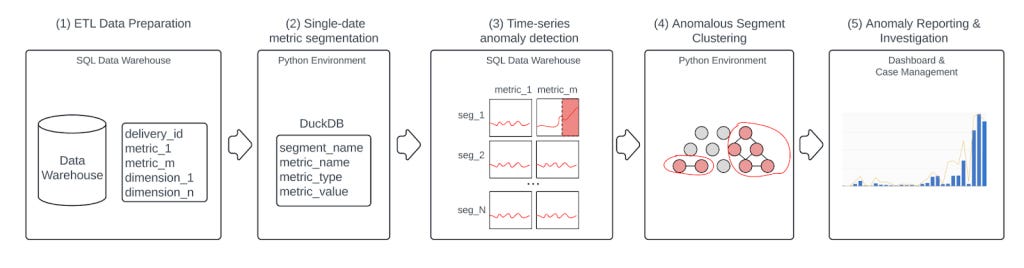
The platform has five steps:
Preparing daily fraud snapshots
Metric aggregation on multi-dimensional segments
Time-series anomaly detection
Hierarchical clustering on anomalous segments
Turning clusters into investigations and containment
Step 1: Preparing daily fraud snapshots
DoorDash chose a daily batch job for the initial implementation because the fraud trends they historically missed developed over a few days to a few weeks.
An Airflow DAG prepares a dataset for each anomaly detection job containing the day’s data snapshot in a wide-table format.
If the trends you historically missed unfold across days and weeks, you do not need sub-second streaming to get meaningful wins. You need consistency, coverage and a reliable cadence.
Step 2: Metric aggregation on multi-dimensional segments
This is the scale step. Once the daily snapshot is ready, DoorDash loads the single date’s data into a Python environment via Spark, then computes metric aggregates across segments.
For each metric, they track both:
Absolute value of the metric
Example: dollar value of credit and refund claims
Relative (normalized) value of the metric
Example: credit and refund claims divided by dollar value of orders
Why both? because absolute values catch ‘this is costing real money’ and relative values catch ‘this is spiking compared to what is normal for this slice’.
Then comes segmentation. Segments are formed from single, double and triple product combinations of all dimensions. That quickly becomes huge and can run into 100s of millions of segments at Doordash scale and compute becomes important
DuckDB for aggregation
DoorDash computes metric aggregates using DuckDB, an in-memory Python database optimised for fast OLAP-style operations.
They chose DuckDB because it was:
Much faster (less than 10 minutes)
More memory efficient than Pandas
The system also excludes dimensional products with cardinality greater than 10^7 to reduce the total number of segments to a manageable size.
Finally, storage format.
The day’s metrics aggregated across hundreds of millions of segments are stored in the data warehouse in sparse tall table format.
In plain English: if a segment has a metric value of zero, DoorDash drops it. That cuts storage and keeps both DuckDB and the downstream warehouse from filling up with rows that say ‘nothing happened here.’
Step 3: Time-series anomaly detection
After Step 2, DoorDash has daily metric aggregates by segment. They keep the previous 28 days of data in the data warehouse, so the platform now has several hundred million metric time series, each of length 28.
DoorDash chose a simple moving-window z-score approach, because it performed well in testing and detected all historical fraudulent trends they used as positive examples.
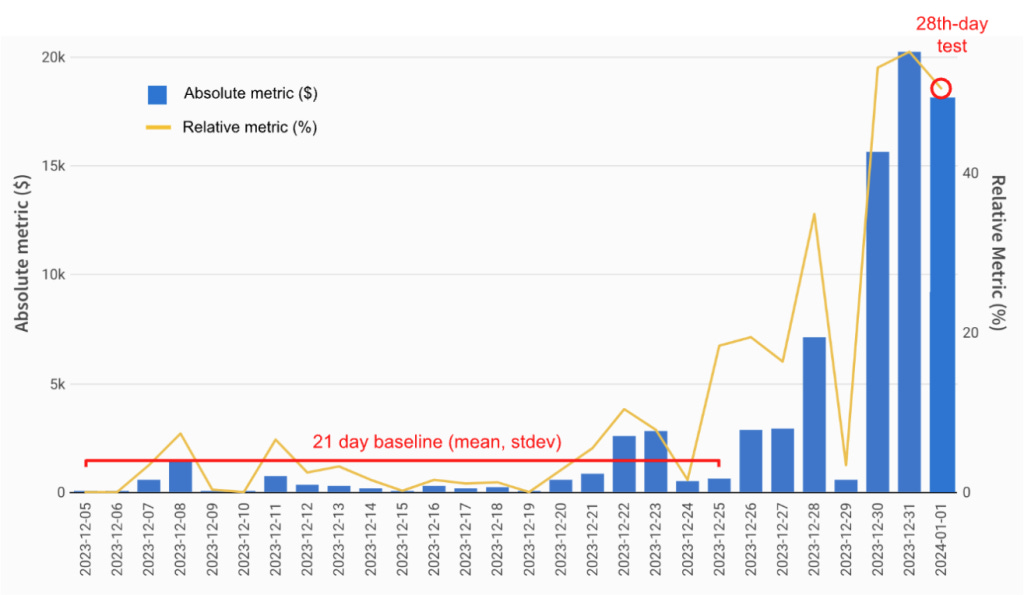
Baseline and test setup
First 21 days form the baseline
The 28th day is the test day
There is a 7-day gap between the baseline and the test day
That gap exists for a very specific reason. The team noticed many historical fraud trends had a noisy phase when they first started scaling. By leaving a gap, the baseline variance better reflects ‘normal before the trend’ which reduces missed trends.
What counts as an anomaly
A segment’s time series is flagged as anomalous if it meets both:
Statistical significance: The 28th-day relative metric is greater than X standard deviations above the mean of the 21-day baseline. DoorDash found 6 standard deviations worked well empirically.
Business significance: The 28th-day absolute metric exceeds the 21-day baseline by a dollar value and/or count that is meaningful for that metric. Thresholds vary by metric and were chosen with operations partners.
That two-part rule matters. Statistical significance alone finds weirdness. Business significance filters it down to weirdness that’s worth a human’s time.
Step 4: Hierarchical clustering on anomalous segments
Real fraud trends rarely show up as a single clean segment anomaly. A single trend often triggers anomalous increases across many partially overlapping segments. Example:
A spike in credit and refund claims at ‘Retailer One’ could cause anomalies in segments like:
{business_name='Retailer One'}{country='US', business_name='Retailer One'}{business_vertical='retail', business_name='Retailer One'}
So Step 4 exists to shrink ‘thousands of anomalies’ into ‘a few dozen things to look at’.
Segment graph structure
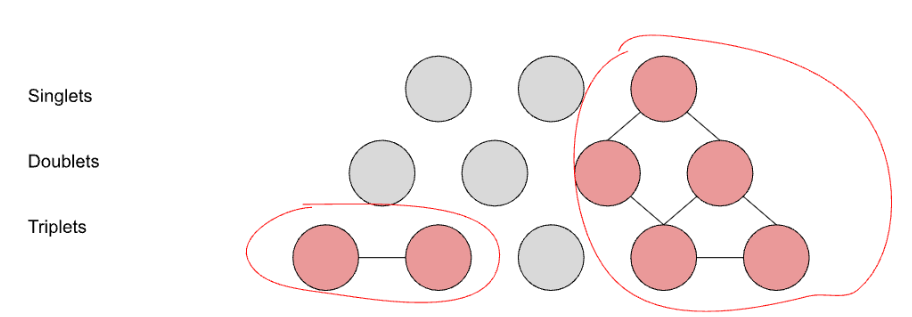
Dimensional segments have a natural structure that can be represented as a three-layer graph:
Top layer: singlets
{business_name='Retailer One'}
Middle layer: pairs
{business_name='Retailer One', country='US'}
Bottom layer: triplets
{business_name='Retailer One', country='US', checkout_platform='iOS'}
DoorDash further partitions the graph by METRIC_NAME so clustering happens within a metric type.
Clustering rules
To connect anomalies within the same metric type:
Connect parent anomalies with child anomalies
{business_name='Retailer One'}is parent of{country='US', business_name='Retailer One'}{country='US', business_name='Retailer One'}is parent of{business_name='Retailer One', country='US', checkout_platform='iOS'}
Connect sibling anomaly triplets if they share 2/3 of their keys and values
{business_name='Retailer One', country='US', checkout_platform='iOS'}
connects with{business_name='Retailer One', country='US', business_vertical='retail'}
Then DoorDash runs a graph partition algorithm to find connected anomaly clusters.
Picking a representative segment
Ops teams review a cluster starting from a single representative segment chosen using a fitness function:
fitness = abs_anom_amt * rel_amt / level^1.2
Where:
abs_anom_amt= 28th-day metric minus the 21-day baselinerel_amt= relative (normalized) 28th-day metric within the segmentlevel= 0 for singlets, 1 for pairs, 2 for triplets
The intuition:
abs_anom_amtbehaves a bit like ‘how much impact’ (think recall)rel_amtbehaves a bit like ‘how concentrated’ (think precision)dividing by a weak function of
levelbiases toward simpler segments
So the representative is usually a segment that is impactful, unusually high relative to its baseline and not needlessly specific.
What volume looks like in practice
In real operation, DoorDash typically sees anomalies in several thousand segments per day. Clustering reduces that to 20 to 60 anomalous clusters per day across consumer and Dasher fraud areas, which is a volume the operations team can realistically investigate.
Step 5: Turning clusters into investigations and containment
Detection is not the finish line, it is just the trigger.
The representative anomalous segments, along with all other segments in the cluster and example events (deliveries and Dasher assignments), are accessible in a workflow tool for ops investigation.
Ops agents review example deliveries or assignments within the representative segment, looking for trends or patterns that may represent a new fraud trend.
Sometimes the pattern is non-fraudulent, like a new promotion causing a spike in refunds. Other times it is fraudulent.
When a trend is deemed fraudulent:
it is root-caused in partnership with engineering and product teams so the root cause can be addressed
a separate containment team runs queries to identify and stop fraudsters matching the trend pattern until product fixes land
So the system is not just detection. It’s detection wired into investigation, containment and longer-term remediation.
Results
DoorDash now uses the anomaly detection platform as its primary early-warning source for new fraudulent trends.
Key results reported by the team:
More than 60% of all new fraud trends today are found through anomaly detection, and that share is growing as coverage expands.
Average time-to-detect new fraud trends dropped from more than 100 days to less than three days over the past year.
The platform saves tens of millions of dollars per year by flagging small but growing fraud trends before they get out of control.
The full scoop
To learn more about this, check DoorDash's Engineering Blog post on this topic
If you are already subscribed and enjoyed the article, please give it a like and/or share it others, really appreciate it 🙏