How Dropbox Made AI Evaluation Work at Scale
Every prompt, retriever and model now has to earn its merge.
Fellow Data Tinkerers!
Today we will look at how Dropbox does eval for its conversational AI
But before that, I wanted to share with you what you could unlock if you share Data Tinkerer with just 1 more person.
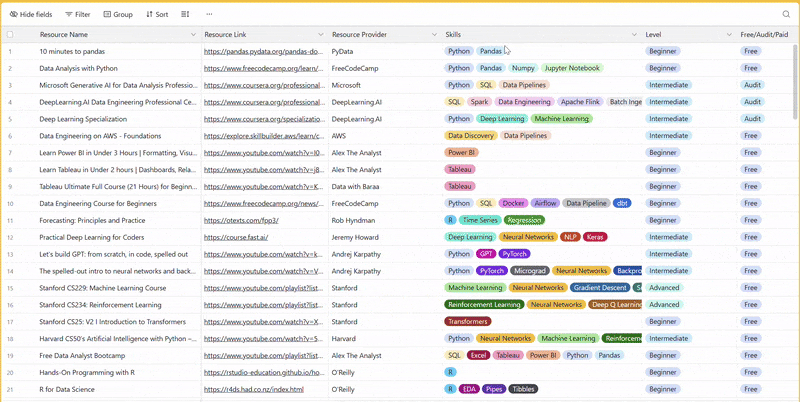
There are 100+ resources to learn all things data (science, engineering, analysis). It includes videos, courses, projects and can be filtered by tech stack (Python, SQL, Spark and etc), skill level (Beginner, Intermediate and so on) provider name or free/paid. So if you know other people who like staying up to date on all things data, please share Data Tinkerer with them!
Now, with that out of the way, let’s get to Dropbox’s AI evaluation!
TL;DR
Situation
Dropbox Dash’s LLM pipeline looked simple but broke easily - tiny prompt tweaks caused regressions and inconsistent answers in production.
Task
The team needed a structured, automated way to test quality and reliability across datasets, prompts and model updates.
Action
They built an evaluation-first system: curated real and synthetic datasets, used LLMs as judges, wired checks into CI/CD and scored live traffic for drift.
Result
Evaluation became part of daily engineering as regressions dropped, releases sped up and Dash’s answers stayed consistent and reliable.
Use Cases
LLM evaluation, prompt version control, automated regression testing, evaluation dashboards
Tech Stack/Framework
RAG, Kubeflow DAG, Braintrust, LLMOps
Explained further
Context
LLM apps look simple from the outside. One text box in, one answer out. Under the hood, it is a relay race of probabilistic steps: intent classification, retrieval, ranking, prompt construction, inference, safety filtering. Nudge any step and the whole chain can wobble. Yesterday’s crisp answer can become today’s confident hallucination.
While building Dropbox Dash, the team learned the hard way that evaluation belongs on equal footing with training. Treat it like production code or pay for it later.
What is Dropbox Dash?
Dropbox Dash is basically Dropbox’s attempt to make “search across everything” actually work. It connects to all the apps where your work lives - Google Drive, Slack, Notion, email, internal docs and gives you one box to search them all.
Think of it as a layer sitting on top of your scattered information, turning piles of disconnected files and messages into something you can query in plain English. It’s more like a context-aware search engine for your company’s knowledge that cites its sources and understands documents.
What follows is their playbook. It covers datasets, metrics, tooling and the feedback loops that keep quality steady while the product evolves. And because work is not just text, the long game includes images, video and audio too.
Start with selecting the right datasets
Early evaluations were ad-hoc. Useful for demos, fragile in production. The team moved to a standardised approach that starts with a clear foundation of datasets, then wraps them in scoring logic that can fail builds.
Public baselines for coverage
They began with established datasets to get quick, comparable signals:
Google’s Natural Questions for retrieval from very large documents.
Microsoft Machine Reading Comprehension for handling many hits per query.
MuSiQue for multi-hop reasoning.
This mix surfaced trade-offs early. For example, a retriever that looked strong on single-hop questions could stumble on multi-hop chains. A prompt that made answers fluent could still miss citations. Public datasets gave breadth and repeatability but they missed the messy ways of real user phrasing.
Internal data for realism
Public sets do not capture the long tail of how people phrase things or the content they search. So the team dogfooded Dash and harvested two internal evaluation streams from employee usage:
Representative query datasets. Anonymised, ranked top internal queries with annotations from proxy labels or internal reviewers. These mirror how users actually ask.
Representative content datasets. Widely shared files, documentation and connected sources. From this content, LLMs generated synthetic Q&A across formats: tables, screenshots, tutorials, factual lookups.
The goal was not a giant pile of examples. The goal was a carefully curated stack that reflects reality: ambiguous phrasing, multilingual inputs, citations that matter and formats beyond plain text.
The mix of public + internal data produced a stack that looked like real life. Good start but still incomplete until wrapped in scoring logic. The next step was turning these examples into a live alert system where each run had to clearly show whether it passed or failed. The success would be defined by metrics, budget limits and automated checks set up before any experiment even started.
Measure what actually matters
It is tempting to rely on familiar natural language processing metrics. BLEU, ROUGE, METEOR, BERTScore or embedding cosine similarity. These are fast and well known. They also miss the mark for real tasks like “answer with sources,” “summarise the wiki accurately,” or “parse a table into Markdown.”
What the usual suspects do well and where they break:
These were useful early on to catch obvious drift. They are not deployment gates. The team saw high ROUGE with missing citations, strong BERTScore with made-up file names and pretty Markdown that hid factual errors halfway down the page. In production, those are not edge cases. They are common.
So they asked a better question: what if the evaluation itself used LLMs to check the things that matter?
Use models to test models
Yes, using one model to judge another sounds recursive. It also works. A judge model can:
verify factual claims against the provided context
confirm that every claim is cited
enforce structure, tone and formatting requirements
scale across domains where wording varies
Equally important, they realised that the rubrics and judge models needed their own evaluation and tuning. Prompts, instructions and even which model you pick can all sway the results. For certain cases like specific languages or technical content they used specialised models to keep scoring consistent and fair. In short, evaluating the evaluators became part of the quality loop.
Structuring LLM-based evaluation
The team treated each judge like a software module. Designed, calibrated, tested, versioned. A reusable template sits at the core. Every evaluation run includes:
the query
the model’s answer
the source context (when available)
A hidden reference answer at times
The judge prompt asks structured questions:
Does the answer address the query directly
Are factual claims supported by the context
Is the answer clear, well formatted and consistent in voice
The judge then returns justification and a score which can be scalar or categorical. A rubric might look like:
Every few weeks the team spot-checked outputs and labeled samples manually. Those calibration sets tuned judge prompts, tracked agreement rates and monitored drift. If a judge wandered from the gold standard, they fixed the prompt or rotated the model.
For each release, engineers manually reviewed 5–10% of results, logging any discrepancies and tracing them to prompt bugs or model hallucinations. To make things more consistent though, the team created new metrics.
Three metric types, three roles.
To enforce consistency, the team defined three metric types: boolean gates, scalar budgets and rubric scores. each one was baked into the development pipeline. Every model version, retriever tweak or prompt update was tested against these standards. If performance dropped, the change didn’t move forward.
Metrics were wired into every stage: quick regressions on pull requests, full suites in staging and live scoring in production. Dashboards tracked results over time, ensuring the same evaluation logic governed every change - bringing consistency, traceability and dependable quality control.
Scale the evaluation
After a few build-test-ship cycles, one truth became obvious: scattered notebooks and artifacts cannot carry a production pipeline. You need structure.
The team adopted Braintrust as the evaluation backbone. Four capabilities mattered most:
Central store. A unified, versioned repository for datasets and experiment outputs. No more guessing which CSV is “final_final_v7.”
Experiment API. Each run is defined by dataset, endpoint, parameters and scorers. It produces an immutable run ID. Lightweight wrappers make this easy to use.
Dashboards for comparison. Side-by-side views flag regressions quickly and quantify trade-offs across latency, quality and cost.
Trace-level debugging. One click to see retrieval hits, prompt payloads, generated answers and judge critiques.
Spreadsheets were fine for demos. They collapsed once real iteration began. An evaluation platform made runs reproducible, comparable and debuggable for everyone.
Bake evaluation into every commit
Prompts, retrieval settings and model choices are application code and needed to be treated them the same way. That means they had to pass the same automated checks as any other code:
Pull requests. Opening a PR triggered about 150 canonical queries. Judges scored them and returned results in under ten minutes.
Merges. On merge, the system reran the canonical suite plus latency and cost smoke checks. If any red line tripped, the merge was blocked.
Those canonical queries are not random. They covered critical paths like multiple document connectors, no-answer cases and non-English queries. Each test pinned retriever version, prompt hash and model choice. If scores dip below thresholds, the build stops. Regressions that once slipped into staging got caught at the PR stage.
Stress test before users do
Large refactors can hide subtle breakage. For those, the team ran parallel evaluation sweeps. Start from a golden dataset. Dispatch as a Kubeflow DAG to run hundreds of requests in parallel. Every run carried a unique run_id
for clean comparisons against the last accepted baseline.
Metrics focused on RAG:
Binary answer correctness
Completeness
Source F1 to balance precision and recall on retrieved sources
Source recall
Any drift beyond thresholds was flagged automatically. LLMOps tooling sliced traces by retrieval quality, prompt version or model settings to isolate the stage that shifted.
Live-traffic scoring
Offline checks are necessary, not sufficient. Real users ask weird things. To catch silent degradation fast, the system continuously sampled production traffic and scored it with the same metrics and logic as offline suites. Each response plus its context and retrieval trace flowed through automated judgment that measured accuracy, completeness, citation fidelity and latency in near real time.
Dashboards visible to engineering and product showed rolling medians over 1-hour, 6-hour and 24-hour windows. Thresholds guarded key metrics. If source F1 dipped or latency spiked, alerts fired so the team could act before users felt pain. Scoring ran asynchronously in parallel, so user requests did not slow down.
Layered gates
Risk control improved as changes moved from dev to prod. Gates tightened, datasets grew and tests looked more like reality:
Merge gate. Curated regression tests on every change. Must meet baseline quality and performance.
Stage gate. Larger, more diverse datasets with stricter thresholds to catch rare edge cases.
Production gate. Continuous sampling and scoring of live traffic to catch the issues that only show at scale.
If metrics dipped below thresholds, alerts fired and rollbacks could happen immediately. Scaling dataset size and realism at each step blocked regressions early without divorcing evaluation from real usage.
Turn failures into feedback loops
Evaluation is not a phase. It is the feedback loop that drives the next improvement cycle. Gates and live scoring protect users. They also feed the system with the exact failures worth learning from.
Mine the misses. Low-scoring traces from production taught the team what synthetic sets missed:
retrieval gaps on quirky file formats
prompts cut by context windows
tone wobble in multilingual inputs
hallucinations triggered by underspecified queries
These hard negatives flow back into datasets. Some become labeled regression cases. Others seed new synthetic variants. Over time, the system forced itself to practice exactly where it used to stumble.
A/B playgrounds for risky ideas. Not every idea deserves a run at production gates. New chunking policies, rerankers or tool-calling strategies carry risk. The team runs them in a controlled environment against stable baselines:
inputs: golden datasets, user cohorts, synthetic clusters
variants: retrieval methods, prompt styles, model configs
outputs: judge scores, trace diffs, latency and cost budgets
Prove value or fail fast without burning production bandwidth.
Debug playbooks. LLM pipelines are multi-stage. When an answer fails, guessing is expensive. The team wrote playbooks that cut straight to root cause:
No doc retrieved? Inspect retrieval logs.
Context retrieved but ignored? Check prompt structure and truncation risk.
Judge mis-scored? Re-run against calibration sets and human labels.
Triage follows a path not a debate.
Make it cultural. Evaluation is not a side quest for one team. It is part of daily engineering. Every PR links to runs. On-call rotations watch dashboards and thresholds. Negative feedback is triaged and reviewed. Engineers own the quality impact of their changes not just correctness. Speed still matters. Predictability comes from guardrails.
Lessons learned
Early prototypes were stitched together with whatever evaluation data was handy. Fine for a demo. Painful once real users arrived.
Tiny prompt edits created surprise regressions. Product and engineering argued about “good enough” with different mental scoreboards. Worst of all, issues slid through staging into production because nothing was catching them.
The fix was structure.
A central, versioned repository for datasets.
Every change running through the same flows
Automated checks as the first line of defense.
Shared dashboards to replace hallway debates with numbers visible to engineering and product
One surprise: more regressions came from prompt edits than model swaps. One word can tank citation accuracy or break formatting. Humans miss that. Gates do not.
Another lesson: judge models and rubrics are living assets. Their prompts need versioning. Their behavior needs periodic checks. In some cases you need specialised judges for other languages or niche domains to keep scoring fair.
The takeaway is simple. Evaluation is not a bolt-on. Give your evaluation stack the same rigor as production code and you will ship faster and safer with far fewer how did this happen moments.
The full scoop
To learn more about this, check Dropbox's Engineering Blog post on this topic
If you are already subscribed and enjoyed the article, please give it a like and/or share it others, really appreciate it 🙏
Keep learning
How Netflix Used Deep Learning to Slash Video Quality Control Time by 90%
Catching pixel glitches in video used to take hours of manual review. Netflix cut that down to minutes with an automated system built on Deep Learning.
Here’s how they did it and why full-resolution detection matters for them.
How Uber Built an AI Agent That Answers Financial Questions in Slack
Everyone’s talking about AI agents but most examples are still in prototypes or slide decks.
Here’s one running in production at Uber: Finch, a Slack-based AI agent that turns plain-language finance questions into governed real-time answers.
From finding the right dataset to writing the SQL and posting the results, it’s all handled in seconds without leaving chat.