How Canva Rebuilt Its Data Pipelines for Billions of Events per Month
What it takes to track usage, pay creators fairly and not drown in incident recovery hell.
Fellow Data Tinkerers!
Today we will look at how Canva solved the surprisingly messy problem of counting at scale
But before that, I wanted to share an example of what you could unlock if you share Data Tinkerer with just 2 other people.
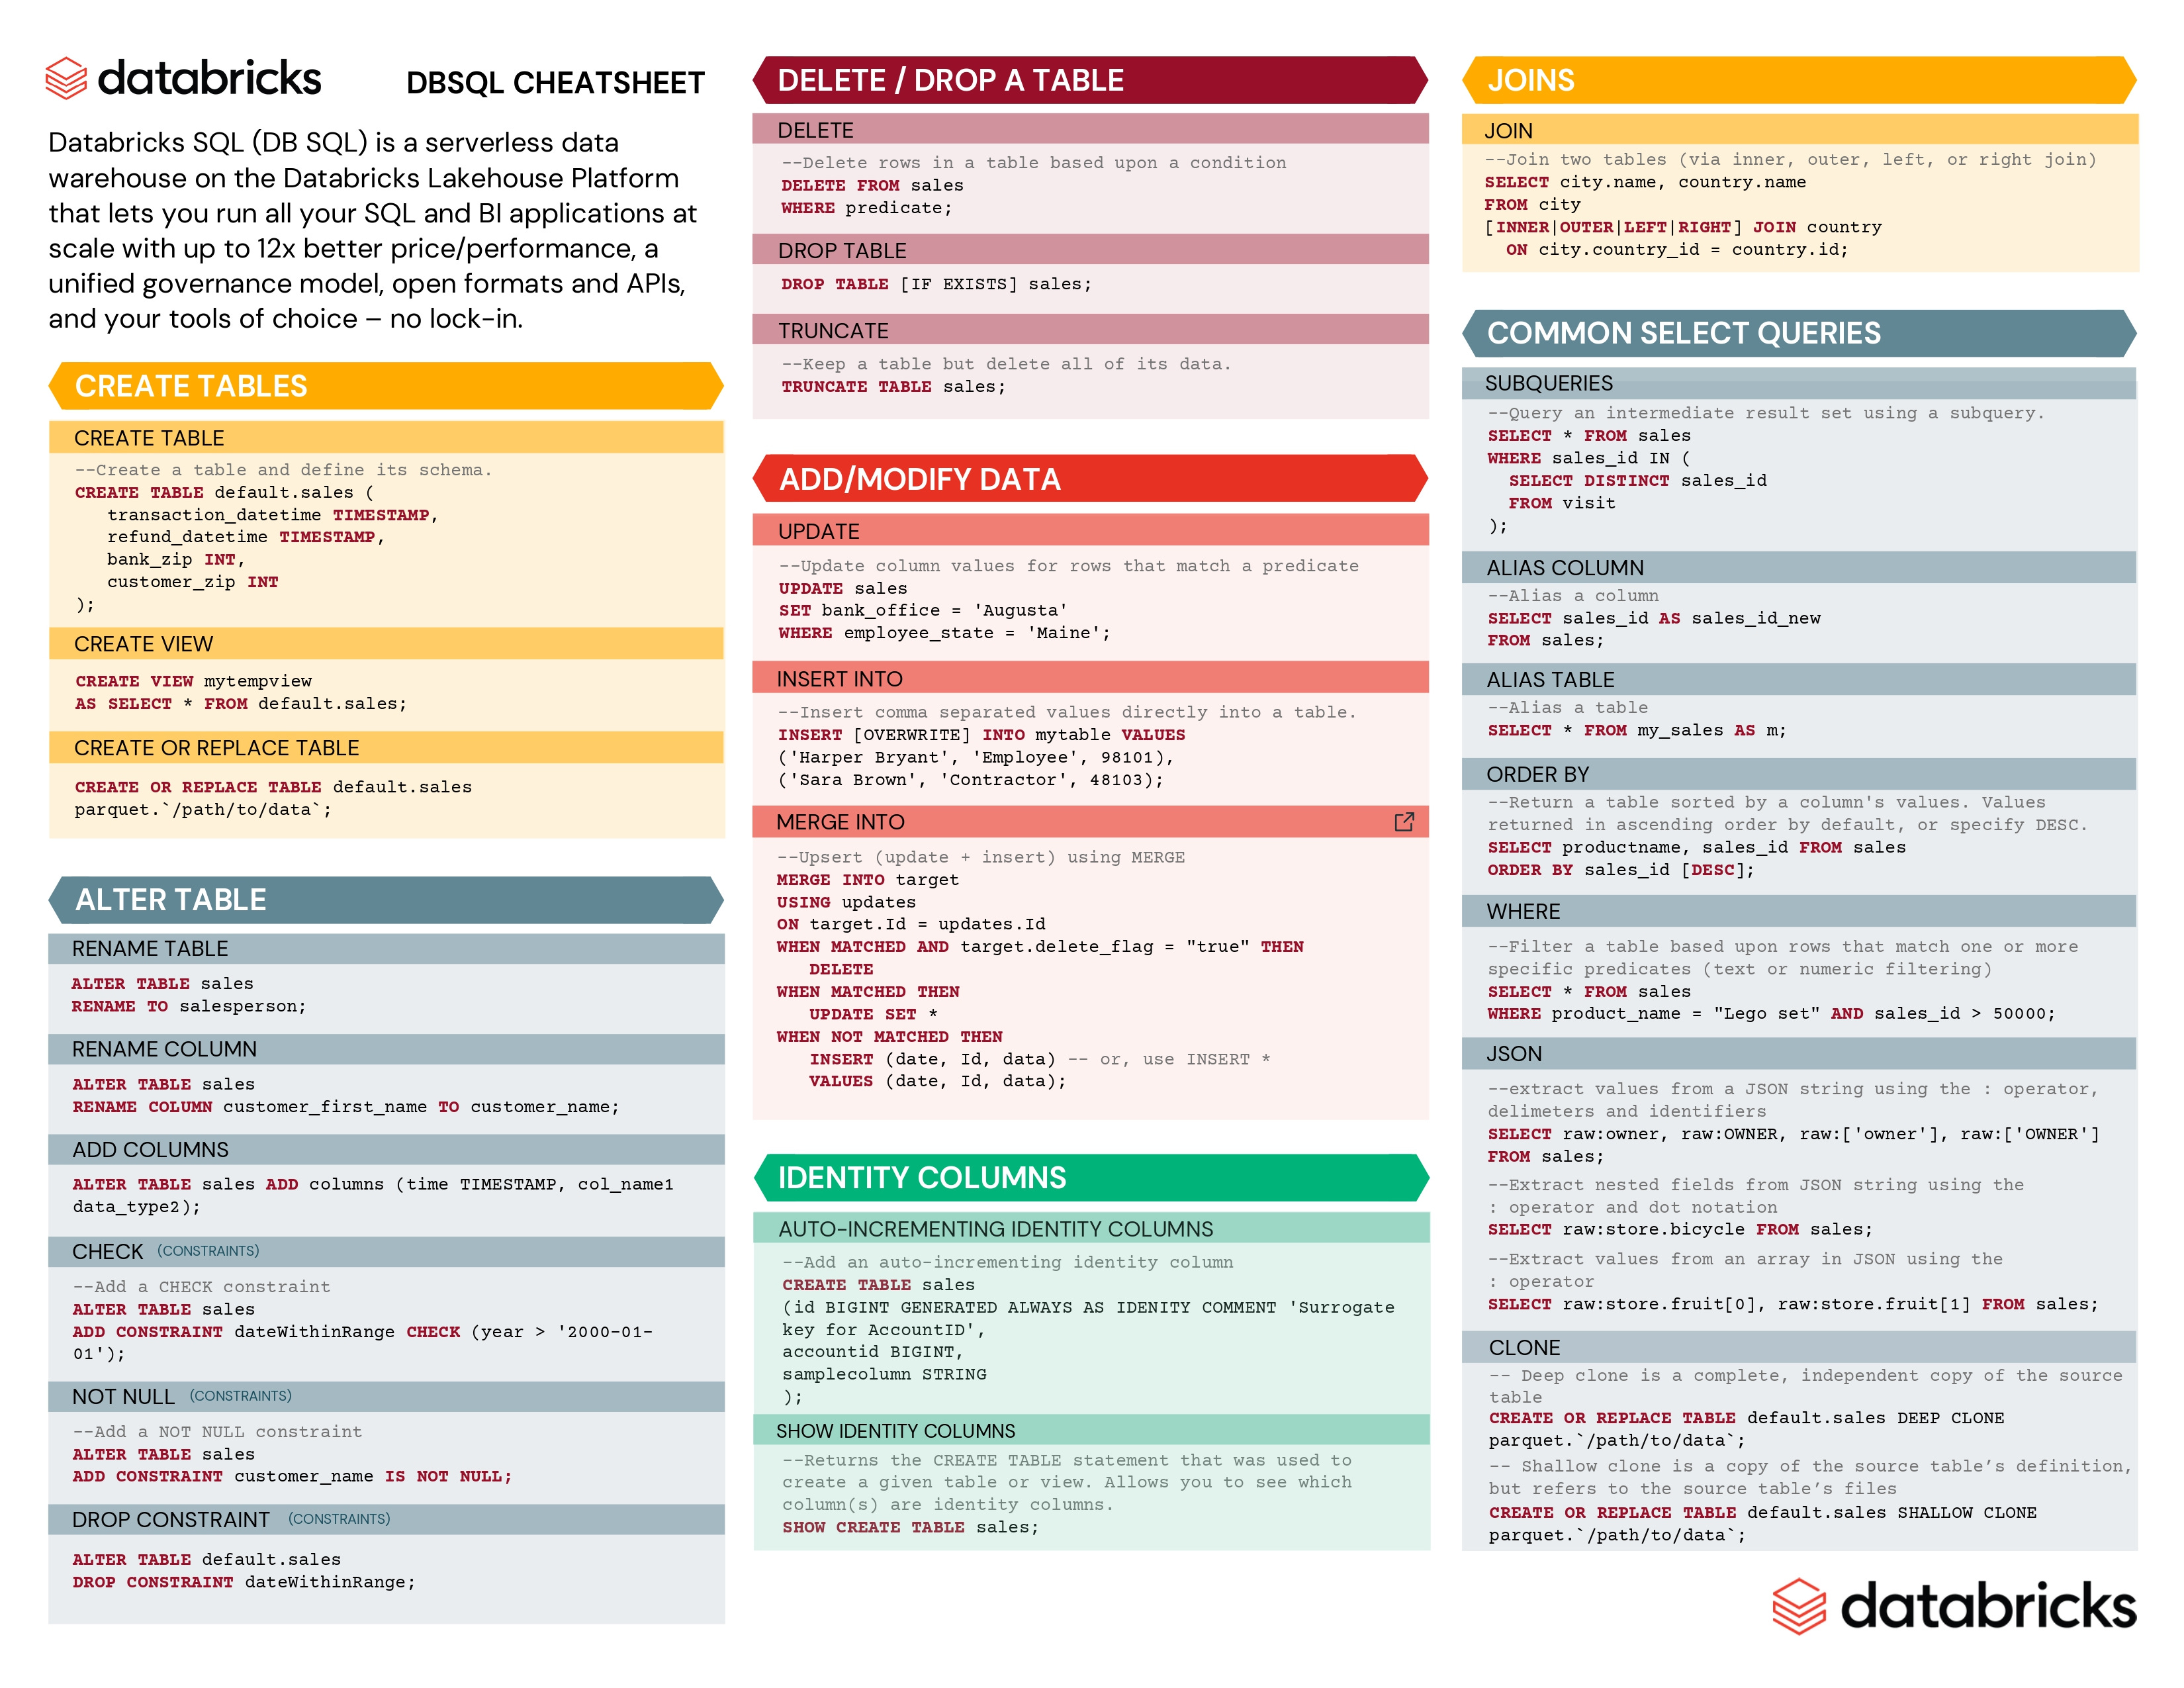
There are 100+ more cheat sheets covering everything from Python, R, SQL, Spark to Power BI, Tableau, Git and many more. So if you know other people who like staying up to date on all things data, please share Data Tinkerer with them!
Now, with that out of the way, let’s get to Canva’s work to build a scalable data pipeline
TL;DR
Situation
Canva’s Creators program exploded in usage, doubling every 18 months. This meant they had to track billions of monthly content usages to pay creators fairly. The original MySQL-based system couldn’t keep up.
Task
Design a scalable, accurate and operationally simple content usage counting system that could handle billions of events, avoid over/undercounting and reduce incident recovery time and engineering overhead
Action
1- Started with MySQL, but ran into scaling and maintenance issues due to single-threaded deduplication, costly round trips and rapid storage growth.
2- Tried moving data to DynamoDB but this didn’t solve the processing bottleneck.
3- Eventually replaced the entire pipeline with an OLAP + ELT architecture using Snowflake and dbt:
Deduplication and aggregation now done as SQL transformations
No more persisting intermediary data but just recompute from raw events
Built observability and rerunability into the system
Unloaded final data to S3 for serving, with SQS and rate-limited ingestion to avoid RDS throttling
Result
Pipeline latency dropped from over 24 hours to under 1 hour
Incident frequency went from monthly to once every few months
Data storage reduced by 50% and thousands of lines of brittle code were eliminated
Broken data can now be fixed by rerunning the pipeline. No manual DB ops needed
Trade-off: higher infra complexity (separate CI/CD, observability, ingestion tuning)
Use Cases
Data storage, usage analytics, operational efficiency, data recovery
Tech Stack/Framework
MySQL, Snowflake, dbt, DynamoDB, Amazon S3, Amazon SQS, ELT
Explained Further
Context
Canva’s Creator program has seen wild growth with usage doubling every 18 months. That brought the headache of accurately tracking billions of monthly content usages. This isn’t just about dashboards or analytics. It’s money. If the count’s wrong, someone’s paycheck is too. So Canva had to build a usage counting service that was scalable, accurate and didn’t crumble under operational pressure.
Let’s walk through how they got there and the challenges they had to overcome.
How it started: the MySQL days
The first version used MySQL and a bunch of workers, each one handling a step in the process. For example:
One worker deduplicated events by scanning a table and tagging each record with an event type.
Another worker scanned the updated table to increment usage counters.
This worked for a while but over time three issues emerged: processing scalability, incident complexity and storage consumption.
Bottleneck 1: processing scalability
Deduplication was single-threaded and sequential. It kept a pointer for the last processed record, which helped with debugging but didn’t scale.
Each event needed at least one read and one write. So for N records, the system made O(N) round trips to the database.
Batching helped a bit, but it didn’t solve the underlying problem. Multi-threaded scans were considered, but they’d make the code harder to reason about and maintain.
Also, any error in a usage event would block all downstream processing.
Bottleneck 2: incident complexity
Incident recovery was manual and messy. There were four main failure modes:
Overcounting
A new usage event type gets added upstream and isn’t filtered out. It sneaks into aggregation, leading to inflated payouts. Fixing this meant pausing the pipeline, finding and removing bad events, and calculating aggregates again.Undercounting
The inverse of overcounting. A new valid event type is added but doesn’t get tracked. The missing data needs to be recovered from backup and backfilled which could take several days and delay payments.Misclassification
Events get miscategorized (e.g. event A counted as event B). This was common because classification rules changed over time. Fixing this meant identifying the bug, pausing the pipeline and recalculating downstream tables.Processing delays
The dedup worker would stall when it hit unexpected or malformed data causing downstream delays.
Bottleneck 3: storage consumption
MySQL RDS instances were scaling poorly. Because horizontal partitioning wasn’t available (e.g. partitioning by itself), the team had to double the instance size every 8–10 months. As you can see from the example below, available storage dropped by 500 GB in just six months:
The database was also shared with other features, making uptime critical. Version upgrades were difficult to perform without downtime. Some mitigations like splitting the database and cleaning old data offered short-term relief. But long-term, the system was approaching its limits.
Trying DynamoDB
To handle growing storage needs, raw events were moved to DynamoDB. This helped alleviate pressure but didn’t solve compute scalability.
Fully migrating to DynamoDB would have required rewriting most of the logic. Even then, round-trip costs for processing would remain. Ultimately, it didn’t justify the effort.
The pivot: OLAP + ELT
The turning point came with a shift to recalculating everything from raw data using an OLAP approach. Instead of incrementally persisting intermediate outputs, the system was redesigned to perform end-to-end aggregation.
Monthly usage records which were twice the volume of the previous approach could now be processed in memory. Snowflake was chosen as the engine due to its strong analytical performance and existing adoption within Canva’s infrastructure.
Extract and Load
Raw usage events were replicated from DynamoDB to Snowflake using a real-time ingestion pipeline. Because JSON format isn’t ideal for querying, the system projects key fields into separate SQL columns to improve performance.
Transform
All deduplication and aggregation logic was redefined in SQL using dbt. Each stage’s output is materialized as a view. This modular design means logic can be updated quickly, and intermediate outputs don’t need to be persisted.
Example transformation (aggregating usage per brand):
The major steps were reshaping raw JSON event data from DynamoDB into structured SQL tables for better querying. Then applying deduplication rules and using GROUP BY to aggregate usage counts.
The final architecture
The latest architecture is built on an OLAP database and an ELT pipeline. Key changes include:
Moving from OLTP databases to OLAP which offers scalable storage and high-performance compute.
Replacing scheduled worker services with a modern ELT pipeline where data is extracted, loaded and then transformed using SQL.
This redesign enables aggregation of billions of usage events in minutes. It has also significantly reduced complexity in the codebase and cutting down incidents from monthly occurrences to once every few months. Recovery from those incidents is now simpler and faster.
Components of the architecture
The system breaks down into three major stages:
Data Collection: Usage events are captured from various sources (e.g. browsers, mobile apps) and validated before processing.
Deduplication: Duplicates are removed based on classification rules that define what constitutes a distinct usage event.
Aggregation: Deduplicated data is grouped and counted across dimensions like design templates and brand identifiers.
Improvements
Performance gains
Snowflake’s separation of storage and compute allows scalable aggregation as shown in the diagram above. pipeline runs that once took over 24 hours now could be done in under an hour.
Simpler operations
Incident recovery is now easier. Instead of manual database edits, issues can be resolved by re-running transformations.
For example, the system uses outer joins to compare current results to previous ones. If a misclassification or overcounting occurs, the outdated results are overwritten.
This pattern makes the system resilient without human intervention.
Code and data reduction
Moving from code-heavy services to SQL-based logic eliminated thousands of lines of Python and reduced stored data by over 50%. It also reduced the number of incidents to once every few months
Tradeoffs
Transformation layer separation
dbt transformations are managed separately from application code. This requires extra coordination when changing schemas and introduces overhead with its own CI/CD pipeline.
OLAP isn’t built for low latency
While Snowflake does well at batch processing, it can’t serve low-latency queries. To bridge this, Canva built a service to unload data from Snowflake to S3, and then ingest it into RDS using SQS for durability.
Ingestion rates must be carefully tuned. If they are too fast the service databases experience CPU spikes:
Infrastructure complexity
The ELT pipeline introduced more moving parts: data replication, transformation orchestration, ingestion and observability layers. While more robust, the system requires significant infrastructure maturity to maintain.
Results
Canva’s content counting service had to evolve rapidly to keep up with usage growth and ensure creator payments remained accurate.
Key takeaways from the journey:
Simplicity scales: Eliminating intermediate storage and recomputing end-to-end made the system more robust and easier to debug.
Early choices were valid: The original MySQL-based system helped the team ship fast. The real win was knowing when to evolve.
Visibility is essential: Monitoring ingestion latency, warehouse throughput and pipeline health helped catch issues before they impacted creators.
By moving to OLAP and ELT, Canva reduced complexity, improved performance and built a foundation that can scale with future growth.
The Full Scoop
To learn more about this, check Canva's Engineering Blog post on this topic
If you have any other feedback, please reply back to the email. I read all replies and really appreciate it :)
If you are already subscribed and enjoyed the article, please give it a like and/or share it others, really appreciate it 🙏