How Expedia Monitors 1000+ A/B Tests in Real Time with Flink and Kafka
A look inside the pipeline that spots underperforming experiments in minutes and not days
Fellow Data Tinkerers!
Today we will look at how Expedia Group monitors A/B tests at a large scale
But before that, I wanted to share an example of what you could unlock if you share Data Tinkerer with just 2 other people and they subscribe to the newsletter.
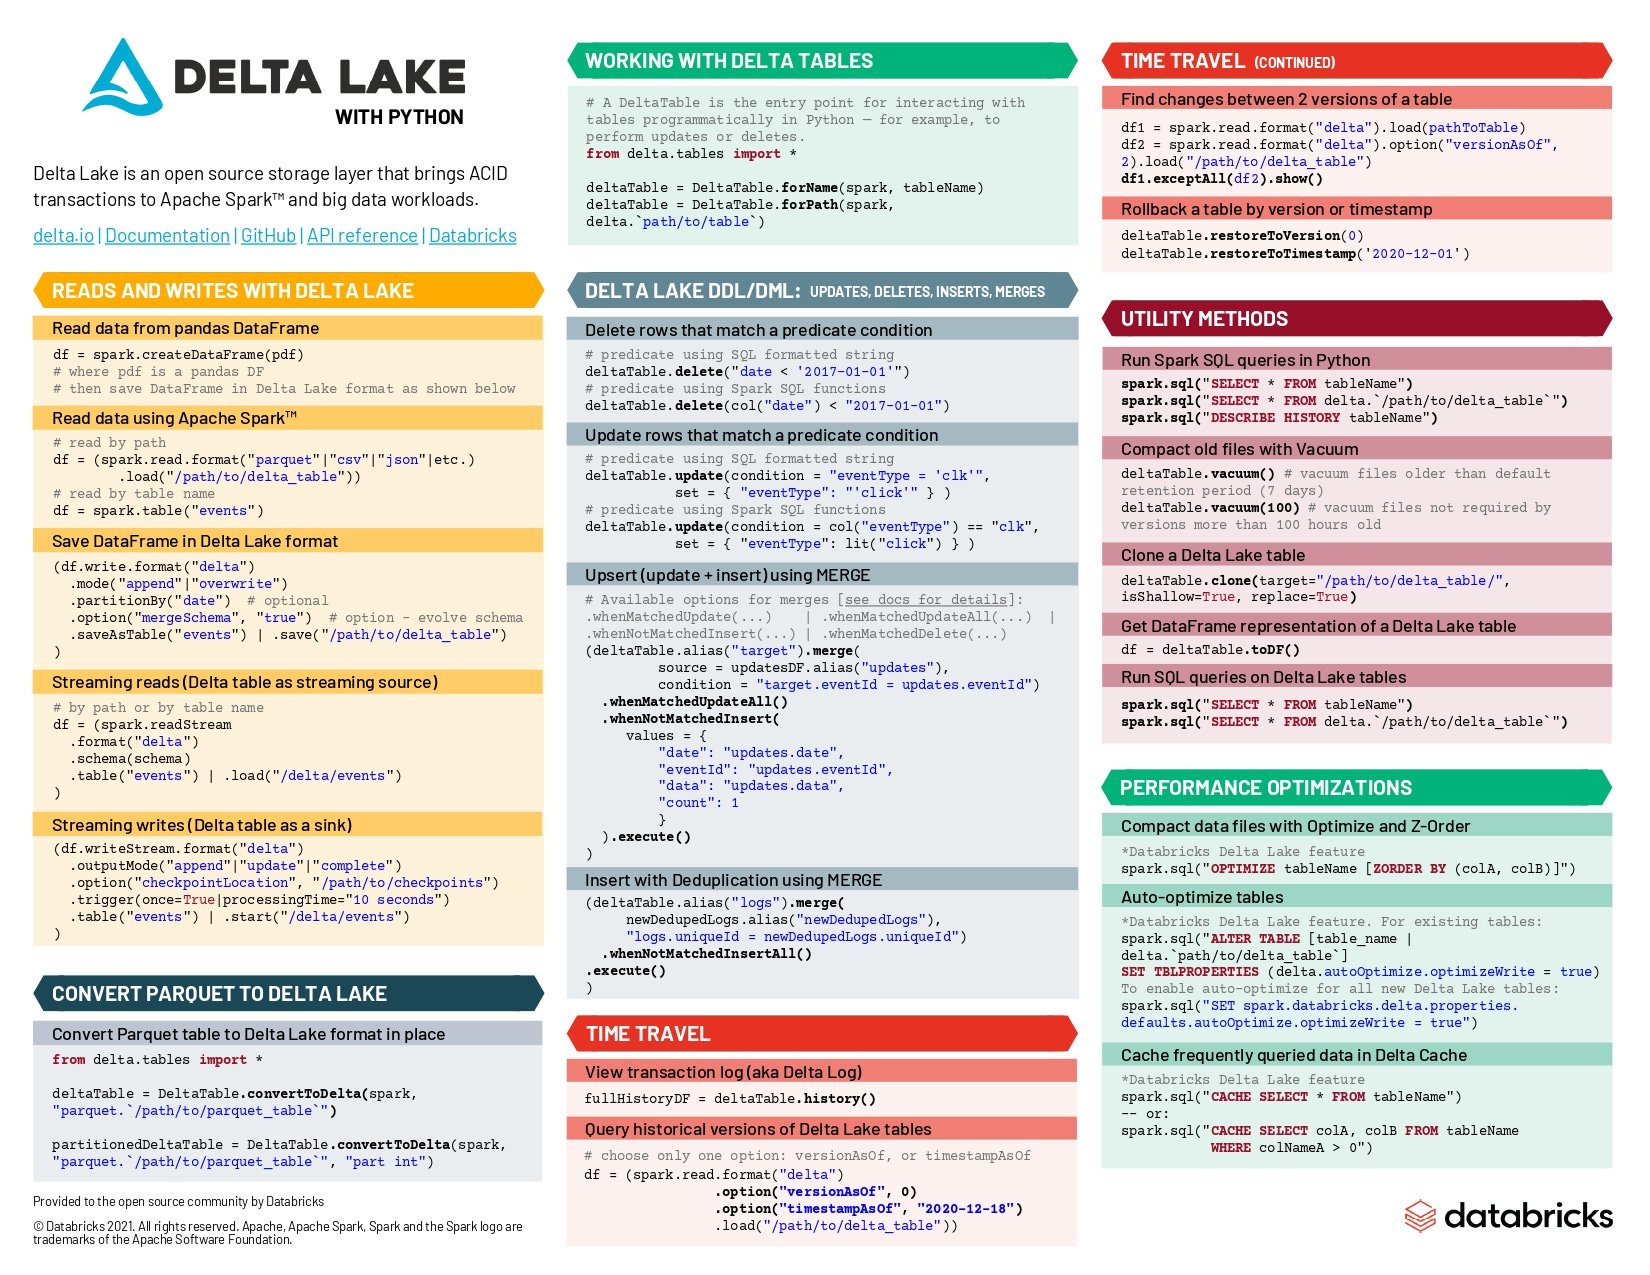
There are 100+ more cheat sheets covering everything from Python, R, SQL, Spark to Power BI, Tableau, Git and many more. So if you know other people who like staying up to date on all things data, please share Data Tinkerer with them!
Now, with that out of the way, let’s get the real-time monitoring of A/B tests by Expedia
TL;DR
Situation
Expedia merged its legacy A/B testing systems into a single platform and realized a critical gap: they had no real-time visibility into the first 24 hours of a test which is often the riskiest period.
Task
Build a real-time monitoring system that could detect and stop underperforming experiments within minutes of launch without false positives or duplications.
Action
Used Apache Flink to build a stateful streaming system with three stages:
Filter irrelevant data
Track user-level exposures and metrics (with bot logic)
Aggregate results in rolling windows with exactly-once guarantees
Result
95% of tests covered
21% of release changes monitored
36% of test issues caught within 24 hours
Detected a –39% conversion dip in one test within minutes
Thousands of days of testing saved by flagging bad setups early
Use Cases
Real-time experiment monitoring, A/B testing infrastructure, early failure detection
Tech Stack/Framework
Apache Flink, Apache Kafka, Apache Avro
Explained further
Background
At Expedia Group, multiple A/B testing platforms from legacy acquisitions were merged into a single, unified solution: Expedia Group Test and Learn (EGTnL). One of the platform’s most important jobs is risk management, ensuring experiments don’t go rogue and tank key metrics without anyone noticing.
While the team had a reliable batch-based system to make long-term rollout decisions, there was a big gap in coverage: the first 24 hours of an experiment. That early window is often when the biggest problems show up and it’s also when visibility was thinnest.
To close that gap, the team built the EGTnL Circuit Breaker: a real-time monitoring system that watches every live experiment and automatically halts underperformers within minutes of launch.
This post dives into the data engineering behind that system, focusing on how the team build a real-time, stateful streaming engine that powers the whole thing.
Why real-time A/B is important
In a product-driven company like Expedia, A/B testing is everywhere. Every tweak, every rollout, every change to copy, layout or pricing logic gets tested. That’s great for learning and iteration but it also opens the door to risk. Bad tests, if left unchecked, can lead to revenue drops, customer frustration and long-term brand damage.
And with thousands of tests running across different regions, products and channels, manual oversight doesn’t scale. Something can break down quickly in silence.
Running tests without real-time visibility is like flying without instruments, you won’t know there’s a problem until it’s too late. That’s why the team invested in a system that can flag and stop problematic experiments on the fly, ideally before the damage snowballs.
Two stages of a circuit breaker
Stopping an A/B test early breaks down into two big technical phases:
Real-time data collection & aggregation: Capture user exposure and behavior across variants fast, at scale and with high accuracy.
Data analysis: Apply statistical methods to flag a variant that’s clearly underperforming.
This article focuses on the first part: the data engineering side. How the team uses Apache Flink to collect, aggregate and deduplicate metrics in real time.
Why Apache Flink?
Apache Flink was picked because it handles the three hard things of stream processing right out of the box:
Fault tolerance (it keeps working even if some parts crash)
Event-time processing (data is processed based on when events actually happened not when they arrived)
Exactly-once semantics (each event is counted just once with no duplicates or missing data)
For a system that needs both high accuracy and high throughput, Flink gave the right mix of power and control. Flink apps run on a distributed cluster with a Job Manager (coordination) and Task Managers (actual work). It’s battle-tested and gave the Expedia team the low-level control they needed to wrangle user-level state.

Experimentation 101: The metric landscape
Before digging deeper, here’s a quick rundown of key experimentation concepts:
Exposures: The number of times users are shown a specific variant.
Metrics: Actions that users take post-exposure. These come in three flavors:
Binomial: 0 or 1 outcomes (Did the user click?)
Continuous: Any numeric value (Revenue per user, searches per session)
Ratio: A metric divided by another metric (e.g. conversion rate = orders / visits)
To run stats on continuous metrics, you need the standard deviation. That means tracking sum of squares so you can figure out variance - basically how spread out the data is.
Building a system that gets it right
For the system to work, the team set out to get their design goals and technical requirements straight.
Design goals
Two goals drove the architecture:
Accuracy: False positives - i.e., shutting down a perfectly good experiments - aren’t just annoying, they break trust with the platform. So the system had to be statistically sound and avoid them.
Timeliness: Bad experiments need to be caught early. The MVP target was to deliver reliable insights within 10 minutes of a test going live.
Technical requirements
Here’s what the system needed to support:
Distinct user tracking: Count each user once, per variant.
Metric tracking per user: For continuous metrics, also track how often users contributed and their sum-of-squares.
Cumulative tracking: Aggregate metrics from the start of the A/B testing
24-hour batch validation: After 24 hours, batch results become available so the real-time system’s output had to be easy to compare for validation.
10-minute freshness: Results had to be ready within 10 minutes of test launch.
Bot exclusion: If a user is flagged as a bot, their metrics and exposures should be removed. If they’re later reclassified as human, those numbers need to be re-added.
So far, this sounds like your usual keyed aggregation problem. But as usual, the devil is in the details.
Why this wasn’t a standard streaming aggregation problem
At first glance, this sounds like your run-of-the-mill aggregation problem: group events by (experiment, variant) and aggregate values in a time window. But it’s not as easy as you might think.
The distinct exposures and metrics problem
Each user should only count once per experiment/variant, otherwise your stats get messy. Binary metrics (like clicks) are easy to dedupe but continuous ones (like revenue) need sum and sum of squares tracked per user. That means you have to hold onto user state to calculate things properly.
The bot problem
Bots make up a big chunk of traffic, but they’re useless for A/B testing. Since bot classification can change over time, the system needs to retroactively add or remove their data. This back-and-forth adds a whole extra layer of stateful logic most streaming systems don’t deal with.
The scale problem
Grouping by experiment and variant sounds fine — until you’re handling millions of users with their own histories. You can’t just shove everything for one test into a single task manager and hope for the best. The system has to stay accurate at user level and scale horizontally under serious traffic.
How the solution actually works
Once the problem definition was nailed down, it was time to build a real-time A/B test engine that could actually keep up.
The inputs: four data sources
Expedia runs on Apache Kafka for streaming and this system needed to pull in four main data feeds:
1- Exposure Kafka topic: Logs which user saw which experiment and variant
2- Clickstream Kafka topic: Tracks user actions - these are the metrics we care about
3- Bot classification Kafka topic: Flags whether a user is human or a bot
4- Experiment metadata API: Feeds in live experiment data like start times
The pipeline: three stages of performance
The team split the pipeline into three stages - filtering, user state collection, and aggregation - all built on Flink’s DataStream API so they could manage state and windowing properly.
1. Filtering
This stage exists purely to cut down the volume of data flowing through the pipeline. No point wasting compute on noise.
First, they ditch exposure events from experiments that started more than 24 hours ago.
Then they discard any clickstream events that aren’t tied to the tracked metrics.
Whatever survives gets remapped from Avro schemas into Flink POJOs, which lets the team serialise the messages more efficiently downstream.
2. User state collection
Next, they start pulling Kafka data together and counting exposures + metrics for each user.
User state is sharded across all Flink Task Managers and lives in memory
They use a custom
KeyedProcessFunction
to manage itEvery 5 minutes, they emit metrics for non-bot users to move to the next stage which is aggregation
This step is where things start getting a bit stateful and sticky but manageable.
3. Aggregation
This was the hardest part of the system. It had to be scalable, count each user exactly once and also account for bot status changes (which can flip mid-stream). If a user turns out to be a bot later, they need to subtract all their previous counts.
For the first cut of the design, they took the “keep it simple” route. Since they only cared about the last 24 hours of activity at any point in time, they could get away with recalculating everything on a rolling basis. The trick was making sure each user only shows up once across the cluster.
To get there, they made sure the aggregation stage fully distributed the work across all Task Managers and leaned into two types of time windows:
Partial aggregation window: User-level exposures and metrics get split into K groups (where K = number of Task Managers). Each group calculates partial results for the last 24 hours.
Final result window: These partials are then re-grouped by experiment ID to produce the final aggregate metrics.
This windowing setup gave the team decent performance and got them just enough accuracy to catch early signals without overengineering things on day one.
Known limitations and trade-offs
While the design we’ve walked through works well enough and gives an early visibility into how experiments are going, it’s not perfect. Two big issues came up pretty quickly.
1. Result lag
Since aggregation was run every 5 minutes in fixed intervals, insights always lagged behind real time. Add a few minutes of processing time and the total delay could be 8–10 minutes. That’s still fast but not instant.
2. Scalability bottlenecks
The app’s performance isn’t consistent. Most of the time, it hums along fine. But every time an aggregation window kicks off, compute usage spikes hard.
This pattern creates two headaches:
Wasted spend: They have to provision for the worst-case CPU usage during those bursts which means overpaying during quiet periods.
Operational risk: Those spikes increase the chance of failures like timeouts or cluster flakiness in general.
Right now, the system can handle a 4x increase in test volume without breaking a sweat. But scaling it 20x or 50x? That’d push it into runtime hell with slowdowns, dropped data, higher failure rates and general inefficiency.
What the business got out of it
Despite those growing pains, the EGTnL Circuit Breaker has been valuable to the business. Thanks to Apache Flink handling the heavy lifting for aggregations, they have been able to spot experiment issues almost as soon as they happen. That’s allowed teams to pause or pull bad tests before they do real damage whether to revenue or user experience.
In its first 6 months live, here’s what it pulled off:
Covered 95% of all A/B tests
Monitored 21% of all release changes
Automatically caught 36% of experiment issues in the first 24 hours
Flagged and shut down an experiment that tanked conversions by –39%—within minutes
Saved thousands of days of test time by catching misconfigured setups early
It’s already delivering serious value but it can still be improved. The next step is solving for true real-time processing and scaling this thing in a way that doesn’t blow up cost or stability.
Lessons learned
1- Start simple then optimize
Recalculating rolling aggregates every few minutes worked well as a V1 - overengineering early would’ve slowed delivery.
2- Architecture needs to plan for ops from day one
Spiky workloads lead to fragile systems; stability is as important as correctness.
3- Business impact > system elegance
Catching a –39% conversion dip in minutes matters more than achieving theoretical purity.
The full scoop
To learn more about this, check Expedia's Engineering Blog post on this topic
If you are already subscribed and enjoyed the article, please give it a like and/or share it others, really appreciate it 🙏
Keep learning
How Bolt Reconciles €2B in Revenue Using Airflow, Spark and dbt
Bolt processes billions in payments across 45+ countries, but their reconciliation system doesn’t rely on magic (or prayers). It runs on batch jobs, Delta tables and smart modelling choices.
If you're into financial data engineering, this one’s worth your time.
How Flipkart Scaled Delivery Date Calculation 10x While Slashing Latency by 90%
Flipkart (India’s Amazon) ships millions of orders a day. So how do they show real-time delivery dates for 100+ items in under 100ms? Here's how they pulled it off.