How Flipkart Scaled Delivery Date Calculation 10x While Slashing Latency by 90%
Optimising for 100 items in 100ms without breaking the backend (or the bank)
Fellow Data Tinkerers!
Today we will look at how Flipkart solved the problem of calculating delivery date.
But before that, I wanted to share an example of what you could unlock if you share Data Tinkerer with just 2 other people.
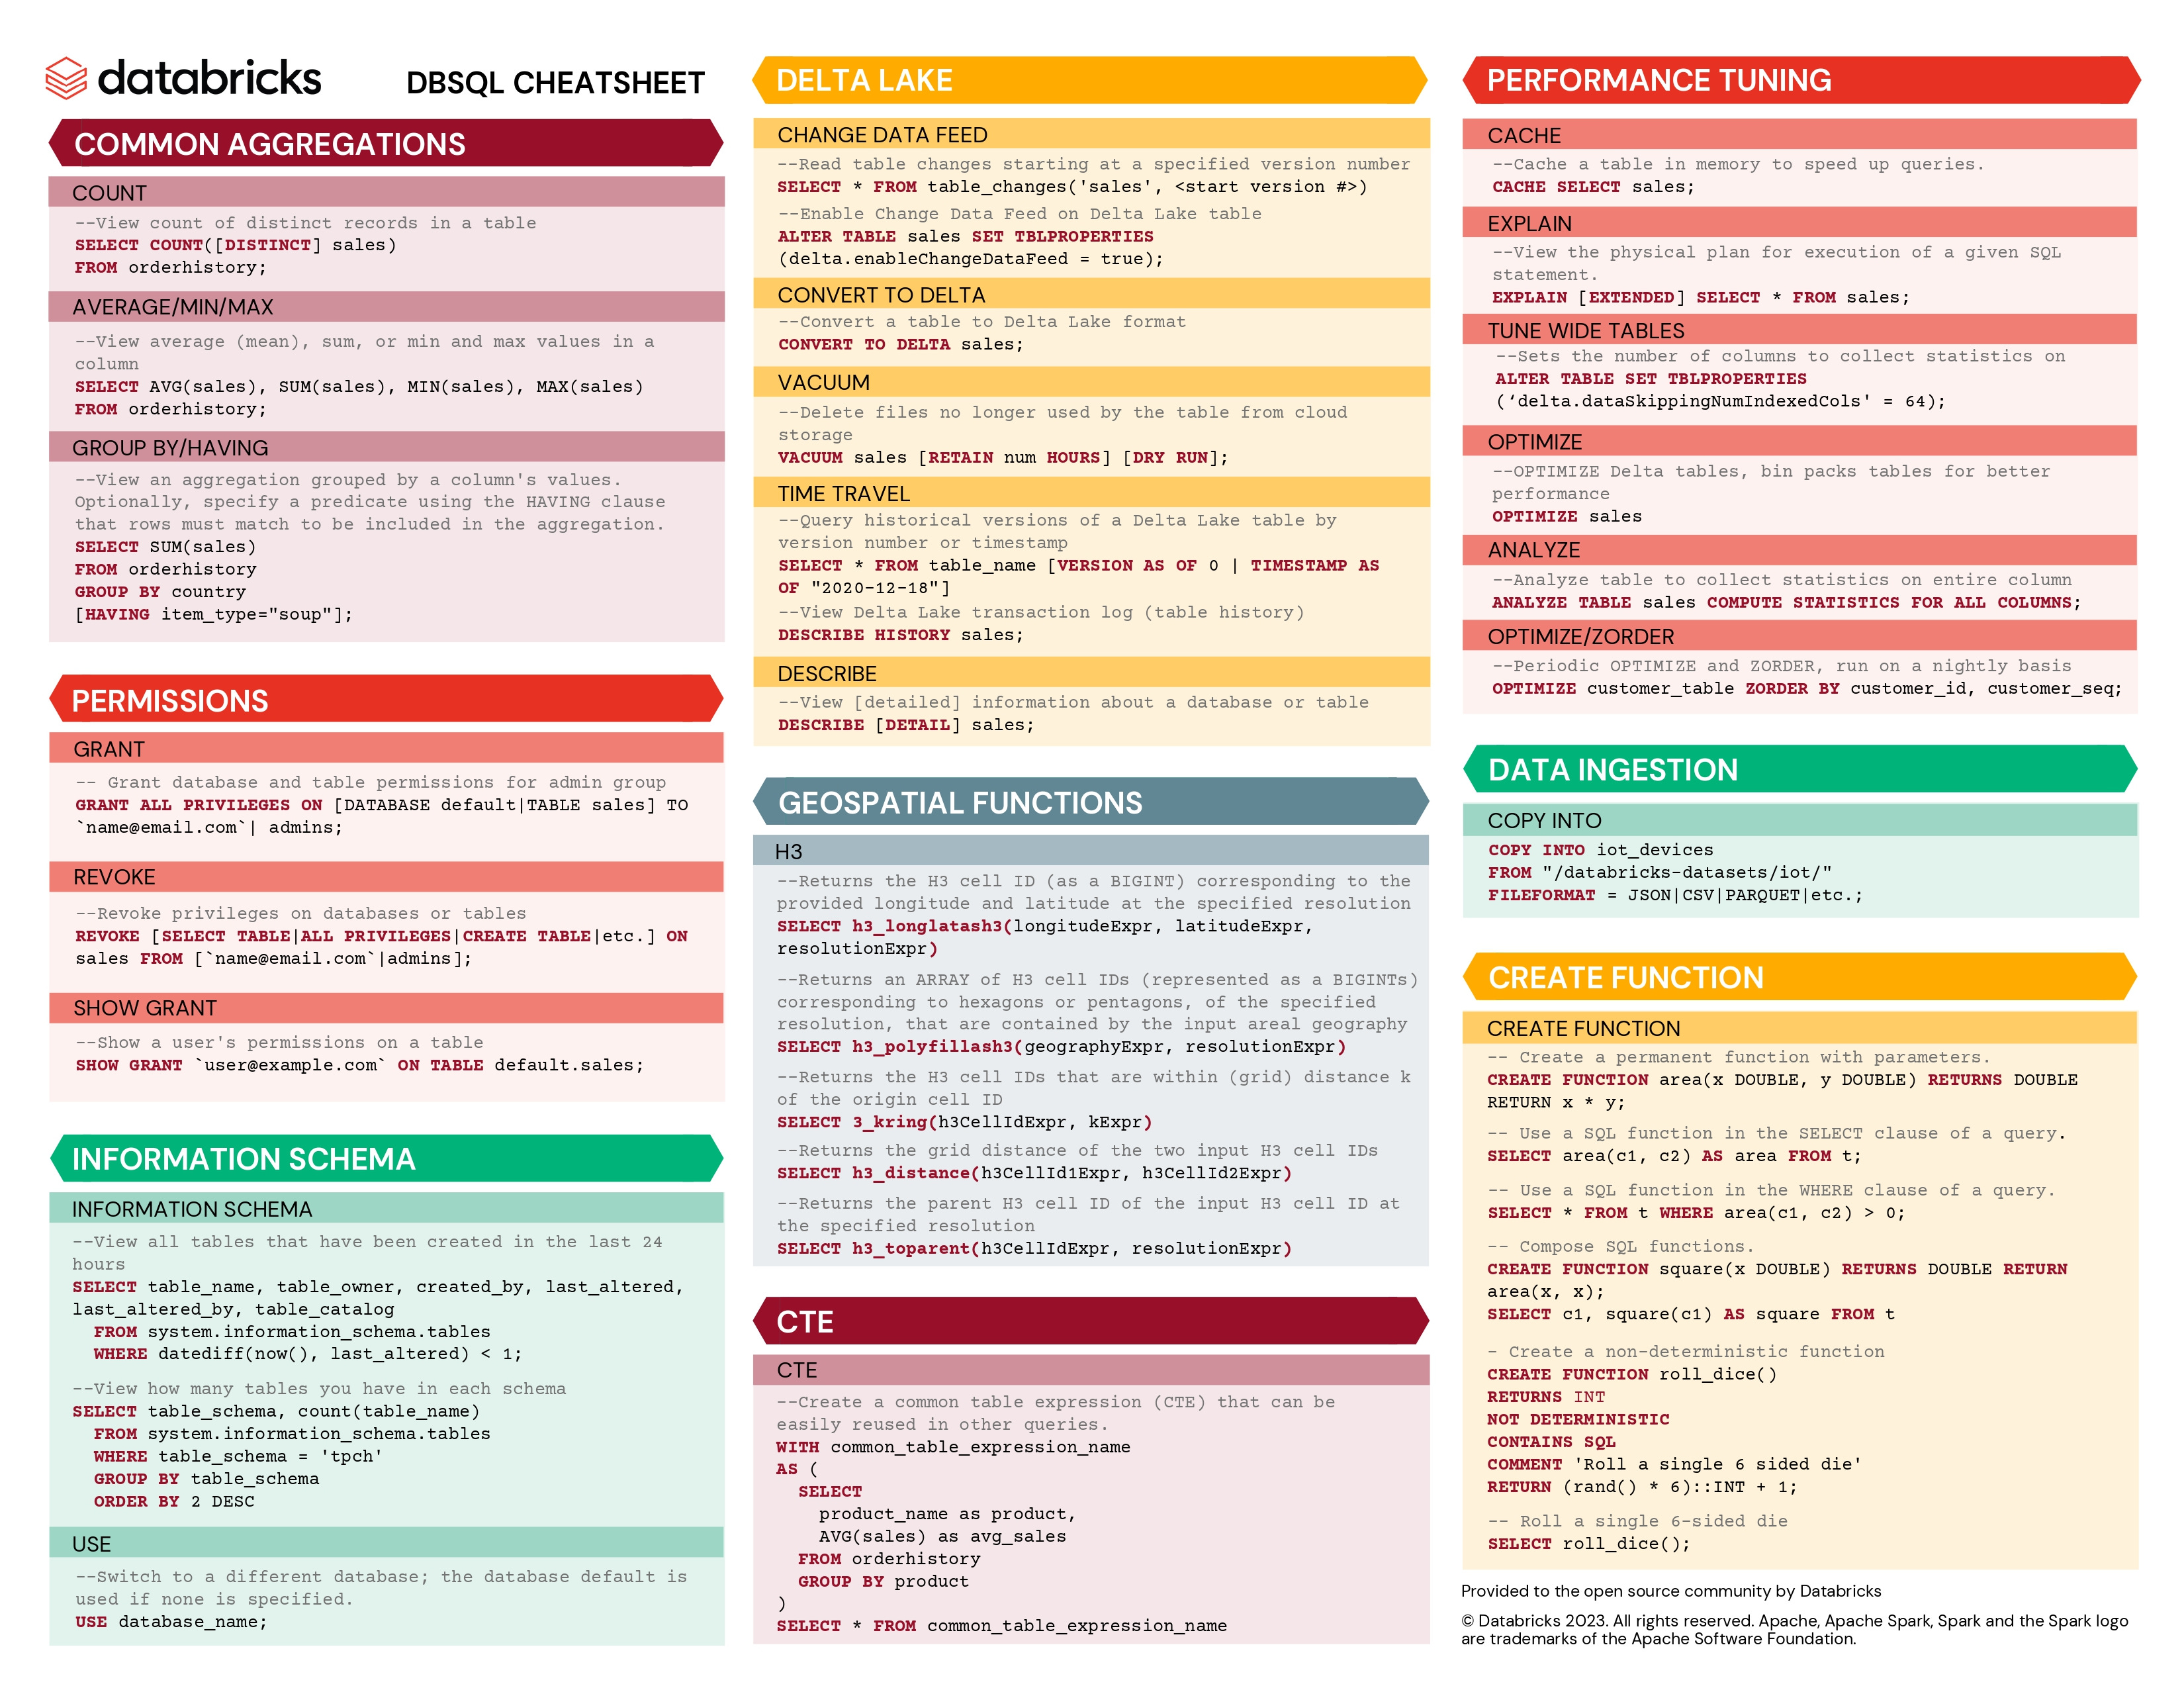
There are 100+ more cheat sheets covering everything from Python, R, SQL, Spark to Power BI, Tableau, Git and many more. So if you know other people who like staying up to date on all things data, please share Data Tinkerer with them!
Now, with that out of the way, let’s get to Flipkart’s challenge of calculating delivery date at scale
TL;DR
Situation
Flipkart needed to show real-time delivery dates on the Search & Browse page for 100 items, under 100ms, at 10x the traffic of the Product Page.
Task
Build a system that could return accurate delivery dates without blowing up latency, compute or cache size.
Action
Split logic into source and vendor capacity
Used bit-encoded caching in Aerospike to compress payloads from 300B to 8B.
Dropped most attributes and used just Tier + VendorType (~95% coverage).
Result
Achieved 90%+ accuracy with 10x QPS under 100ms latency
Reduced network load by 90%
Use Cases
Dynamic SLA calculation, resource allocation, capacity planning
Tech Stack/Framework
MySQL, Redis, Apache Pulsar, Aerospike
Explained Further
About Flipkart
Flipkart is basically India’s Amazon. It offers over 150 million products across 80+ categories and has more than 500 million customers. The massive scale of the company means even something as “simple” as showing a delivery date turns into a high-stakes game of latency, throughput and capacity juggling.
What it takes to show a delivery date at scale
Let’s kick things off with a high-level look at Flipkart’s supply chain and what it actually takes to display a delivery date when you browse the app. It involves a pretty gnarly orchestration of warehouses, cutoffs, delivery hubs and vendor networks.
Here’s the flow: once a customer places an order, the item is picked from the seller’s location or warehouse, packed and then handed over to a delivery vendor. These vendors sort the shipments at central “Mother” hubs and send them to local Delivery Hubs (DHs) based on the delivery address. Finally, a delivery agent shows up at your door with the goods. Simple enough on paper but at Flipkart’s scale, every stage has tight constraints on capacity and timing.
That’s where the Promise team comes in. Their job is to show customers a delivery date (aka Customer Promise Date) that reflects all the real-world constraints without tanking performance. And that date isn’t just shown in one spot, it pops up on the Product Page, Cart, Order Summary and even sometimes on Search.
Jargon 101: the Flipkart edition
To keep things clear, here’s the key terminology used throughout:
Delivery Date (Customer Promise Date): The exact date Flipkart tells you the item will show up.
Source: Where the item is stored, either a Flipkart warehouse or a third-party seller location.
Source Cutoffs: Times in the day when dispatch can happen. If a cutoff is missed or at capacity, the order is delayed to the next available one. For example, a warehouse might have cutoffs at 1:00 PM, 4:00 PM, and 10:00 PM.
Source Capacity: Number of items that can be packed and shipped per cutoff. For instance, if a source capacity at the 1:00 PM cutoff is 20, it can only dispatch 20 items by that time.
Vendors: Delivery partners which are responsible for shipping items from the source to customer
Vendor Capacity: Number of items a vendor can handle per day or timeslot.
PIN code: A Postal Index Number (PIN; sometimes redundantly a PIN code), A six-digit code used in India equivalent to post codes in other countries
The formula behind the actual delivery date
When you load a product page, Flipkart fires off an API call to the Promise service to figure out how long it’ll take to get that item to your doorstep. Similar API hits happen in the Cart and Order Summary pages.
The delivery date boils down to:
Actual_delivery_date = now + procurement_sla + source_handover_time + vendor_sla + vendor_capacity_days
Let’s break that down:
procurement_sla: This is the time taken for the item to move from the seller or warehouse to Flipkart’s first internal hub.
source_handover_time: This is the time needed to pick, pack and dispatch the item to a delivery vendor.
vendor_sla: The time taken by the delivery vendor to move the package from the Flipkart hub to the Delivery Hub nearest to the customer.
vendor_capacity_days: Once the item reaches the delivery hub, this accounts for any wait time before the delivery attempt can be made. If the hub is at capacity, the delivery might be deferred by a day or two.
What the API is really doing under the hood
The batch size for API calls is usually around 7 items on the Product Page and 5 on the Order Summary. For each item, Promise needs to:
1- Figure out eligible sources.
2- Check valid delivery routes to the customer’s pincode.
3- Evaluate which vendors can deliver based on item size, payment type, etc.
4- Pick the best source-vendor pair.
And all of this needs to be done under 1000ms for the Product Page and 1200ms for Order Summary.
Why delivery dates are harder on the Search & Browse page
Things get trickier on the Search & Browse (S&B) page. Here, a user might see hundreds of items at once. The Search backend hits Promise’s API in a batch of ~100 items, all of which need to return availability and delivery info in under 100ms. No exceptions.
Because of that, Promise doesn’t run the full-blown delivery date logic here. It skips source/vendor capacity checks and assumes the fastest vendor can handle it. So the estimate is:
Estimated_delivery_date = now + vendor_sla
This works for speed but comes at the cost of accuracy. If the same logic used on the Product Page (which takes 500+ms for just 7 items) were applied here, the 100ms SLA for 100 items would be blown out of the water. As a result, S&B usually doesn’t show delivery dates unless they’re precomputed.
The challenge
The goal was to show accurate delivery dates for all items on S&B, especially the ones that can be delivered within 4 days without breaking the 100ms limit for 100-item batches. In addition to the latency requirement, it also needed to scale to 10x the Queries Per Second (QPS) of the Product Page.
In other words:
Compute delivery dates for 100 items in 100ms while handling 10x the traffic.
Approaches that didn’t make it (and the one that did)
Approach 1: product page flow on Search & Browse
Let’s just reuse the existing logic, right? That was the first instinct. But turns out, calculating delivery dates for 100 items ballooned to 1000ms latency, and CPU usage went full throttle (100%) on 16-core boxes. At 10x the traffic, this would need a warehouse of servers. That’s a no.
Approach 2: caching the delivery date (first attempt)
Next up: a cache that stores delivery dates for each item and destination pincode (aka postcode).
Cool in theory. In practice? Flipkart sells around 270M items and ships to 19,000 pincodes and that would amount to more than 5 trillion entries:
270 million items * 19,000 pincodes = 5.13 trillion rows
At 10 bytes per row, that’s 51 TB. Just the storage cost alone rules this out, let alone the challenge of updating this cache in real-time as capacities shift.
Approach 3: caching the delivery date (second attempt)
What if the cache is simplified? What if instead of tracking at item level, it is done at Source (aka warehouse) level?
40 warehouses * 19,000 pincodes = 760,000 rows
That’s better, much more manageable. But just warehouse level information is not enough for estimating the delivery date. Other factors need to be considered:
Item size: small, medium, large, etc
Category: book, electronics, mobiles, etc
Shipment type: normal, fragile, inflammable, etc
Different combinations of the factors above will give approximately 90 attributes (aka ‘pivots’). For example, a single warehouse (aka source) could have items that are small, books and fragile, or small, electronics and dangerous:
With 90 pivot combinations, this goes up to 68 million entries:
40 warehouses * 19,000 pincodes * 90 pivots = ~68 million rows
This would amount to approximately 5GB in storage. Manageable for an in-memory store that allows quick lookup. The problem? Keeping it updated.
Flipkart gets millions of orders a day. Every order affects capacity and may shift delivery dates for multiple pivot combinations. Updating all of them in real-time? Not happening.
Approach 4: approximate and split
At this point, the team went back and dissected the existing flow to see what could be stripped, split or short-circuited and they found that the delivery date computation boiled down to three main steps:
1- Pivot Matching: Pull item attributes from a central service to determine which source capacity rules apply
2- Source Capacity: Use the matched Source Capacity to calculate when the item can be handed over to a vendor
3- Vendor Capacity: From that handover time, calculate when the vendor can actually deliver it
Rather than trying to cache the entire delivery date (which was too expensive to update), they decided to split this into two separate caches:
Source Capacity Store (covers Step 2 mentioned above)
Vendor Capacity Store (covers Step 3 mentioned above)
This meant they could store lighter, smarter representations of capacity instead of recomputing everything from scratch. They’d compute the actual delivery date on the fly using the two capacity inputs. No bloated cache invalidation and no stale results. Just enough data to get the job done in memory.
The Promise team then worked with the planning team (the folks who manage daily and future capacity plans) and found something interesting: even though there are many pivot dimensions that technically factor into capacity planning, the vast majority of real-world plans - over 95% - only use two:
Tier (Tier1–Tier4): defines shipping speed and eligible network paths
Vendor Type (LT1–LT5): maps to the type of delivery partner assigned to the order
So instead of matching across all pivot dimensions, they just used Tier and Vendor Type. That single change cut down complexity drastically and still gave them ~95% accuracy for items.
Even better: dropping the other pivots meant they no longer had to call the central item service to fetch attributes. That call alone used to cost 50–100ms per request. By removing it entirely, they clawed back precious time they could now use elsewhere.
This approximation wasn’t perfect but it was fast, predictable and covered the majority of real-world cases. And in a system like this, that’s more than good enough to ship.
The source capacity store: From SQL rows to 8-bit integers
Each Flipkart warehouse (or source) has multiple cutoff times throughout the day, basically slots by which an item needs to be packed and handed off to a vendor. Every slot has a capacity limit and those limits are defined per Source × Pivot (where pivots include Tier and VendorType).
To avoid recalculating this every single time, the team built a cache that holds capacity per cutoff. The app scans through the cutoffs in order and picks the first one with available capacity. Simple in theory, but keeping this cache up to date in real time is where things get fun.
The Pipeline
Since Flipkart was already using Redis for tracking reservations, the team tapped into that. Here’s the high-level flow:
Redis Replicator listens for source capacity changes and pushes updates to a message broker.
Apache Pulsar acts as the broker, broadcasting those changes.
Ingestion Cluster pulls from the source capacity MySQL store and recalculates capacities for each cutoff using Tier + VendorType.
Distributed Cache stores the latest values used in delivery date computation.
Now, multiply that by 100 items per request, ~5 sources per item, and 10 cutoffs per source, and you're looking at ~200 key lookups per API call. This thing needed to support tens of millions of lookups per second, across multiple data centers with updates syncing in milliseconds.
Enter Aerospike
Aerospike was picked for two reasons: it could handle the throughput and it came with built-in cross-datacenter replication (XDR). That meant updates made in one data center would automatically sync to others, no extra plumbing needed.
The schema used integer ordinals for Tier and VendorType. For example, a value of 907 at (0,1) represents a capacity of 907 in the Tier1 and LT2 VendorType for the source and cutoff s1.1690203601. Similarly, Tier2 and LT1 (1,0) has 0 capacity available in s1.1690203601
But even with these optimisations, high QPS traffic during sale events pushed Aerospike to its limits. At ~12K QPS, network throttling started kicking in. Time to trim the fat.
Kill the Zeros, Encode the Rest
The first step was obvious: don’t store zero-capacity values at all.
That alone halved the response size:
But the big win came next. Switch from capacity values to a bitfield.
Each bit represented whether a specific (Tier, VendorType) pair had any capacity at a cutoff. This 8-byte field replaced what was previously 300+ bytes.
The result: 90% reduction in network traffic and handover time could be computed in under 10ms even at full production load.
Vendor capacity store: cutting spillage without cutting corners
Vendor spillage is a fancy term for a basic bottleneck: how many days a delivery hub stays full after an item shows up. A spillage of 2? That means the vendor’s next available delivery slot is two days out, no matter how fast the item got there.
During normal days, though, this isn't a big deal. P95 spillage is effectively zero, meaning most orders are delivered the same day they hit the delivery hub.

So for a while, they hardcoded spillage = 0 into the delivery date calculation. The delivery date accuracy was 80% and it worked fine until it didn’t.
During sale periods, spillage spiked. Order volumes jumped 5x, and the naïve assumption tanked delivery accuracy to under 50%.
So, built a new cache in Aerospike: Vendor × Pincode → 25-day bitfield. Each bit is a day, starting from “today.” A 1
means there’s capacity, 0
means nope. So something like:
101101... → Delivery possible today, not tomorrow, then yes the next day, etc.
This avoids needing to look up hubs entirely. Just jump straight to the delivery window. The cache is compact, fast and easy to maintain. It reuses the same Aerospike infra and pipeline set up for source capacity.
And the payoff? Accuracy shot back up to 80%+ during sales without blowing latency. Not perfect, but way better than playing delivery roulette with hardcoded guesses.
Result
Before all these changes, delivery dates on Search & Browse were a patchwork of offline jobs and limited precomputed data. It didn’t scale.
Afterward, real-time delivery date computation was possible for all items, within 100ms, and at 10x the previous throughput.
Wrapping it up: the trade-off that shipped
The mission was simple: show delivery dates on the Search & Browse page and make it feel instant. The hard part? Doing it without frying the infra or drowning in edge cases.
They started with the obvious stuff: reuse what works on the Product Page. That fell apart quickly under 100ms latency constraints. So they pivoted to lighter approximations, bit-level encoding and cache-driven lookups.
What they ended up with was a system that hits 90%+ accuracy, handles 10x more traffic and keeps response times under 100ms. Not perfect, but production-grade and fast enough that it doesn’t block conversion.
There’s a natural progression as users move deeper into the funnel. Search uses approximate logic, Product gets more precise and Order Summary is near-exact. That wasn’t a side effect, it was a design decision. Push the fast stuff to the top of the funnel and let latency grow with context.
Lessons learned
Here are three lessons learned from Flipkart’s delivery date system overhaul:
1. Accuracy vs. Speed is a balancing act
Going all-in on precision was tempting but approximations using just Tier + VendorType gave ~95% accuracy with a fraction of the cost.
2. Cache what matters, compute the rest
Caching full delivery dates didn’t scale. Splitting logic into source and vendor capacity, then compressing with bitfields, made it work.
3. Design for the funnel, not just the feature
Delivery estimates don’t need to be perfect on Search, they just need to be fast. Save the heavy lifting for later in the user journey.
The full scoop
To learn more about this, check Flipkart's Engineering Blog post on this topic
If you are already subscribed and enjoyed the article, please give it a like and/or share it others, really appreciate it 🙏
Keep learning
How Notion Brought Order to Its Data Chaos (And Why Their First Catalog Failed)
Notion’s data went from total chaos, wild JSON, missing docs, nobody knowing what anything meant to a system where most events, tables and definitions are actually discoverable (and up to date).
In this article we look at the failures, the lessons and the step-by-step playbook that finally got Notion’s catalog working for their team.
How Canva Rebuilt Its Data Pipelines for Billions of Events per Month
Canva had to track billions of events to pay creators fairly and their old system couldn’t keep up. Curious how they rebuilt it? This article is for you